About MDS Aerotest Forecasting
Overview
This Glacier Weather Dashboard provides a powerful decision aid to support schedule planning for aircraft engine icing certification tests. Automated data ingestion is implemented for current surface observations as well as short term (48hr horizon) and medium term (10 day horizon) forecasts. By aggregating this information into graphical presentations, the Dashboard helps users to visualize when test window opportunities are likely to occur. The dashboard became operational in 2023 and may be accessed at https://www.glacier-wx.com.
Purpose
Because air temperatures for icing tests at Glacier are produced under naturally occurring conditions, reliable temperature forecasts are important. Further, engine certification test requirements may have a temperature tolerance as small as 2°C (target ±1°C). This is because varying air temperatures can dramatically affect the adhesive strength and density of ice generated from super-cooled water droplets, which can further affect an engine’s response to ice accretion.
An important aspect of the Glacier Weather Dashboard is customized forecasting to accommodate unique topography effects near the test site. It has been found that the local temperature at the Glacier test site can temporarily become up to 10°C warmer than at Thompson, MB airport, which is the nearest public meteorological station. Atmospheric conditions of calm nights and clear skies, together with topographic sheltering and drainage effects can promote development of cold air pools in valley bottoms and the opposite over hilltops. These events, termed nocturnal temperature inversion (NTI) are a distinct forecasting problem for Glacier.
Examples of NTI are shown in Figure 1 which shows observed temperature and wind speed at Glacier and the Thompson airport (cyth) over a 10-day period. On several occasions, temperatures at the two stations diverge on a nocturnal cycle but consistently converge after sunrise, or if higher wind speed prevails overnight.
The Glacier Weather Dashboard has approached this unique forecasting problem by combining machine-learning modifiers to georeferenced output from Meteorological Service of Canada’s high resolution deterministic prediction system (HRDPS).
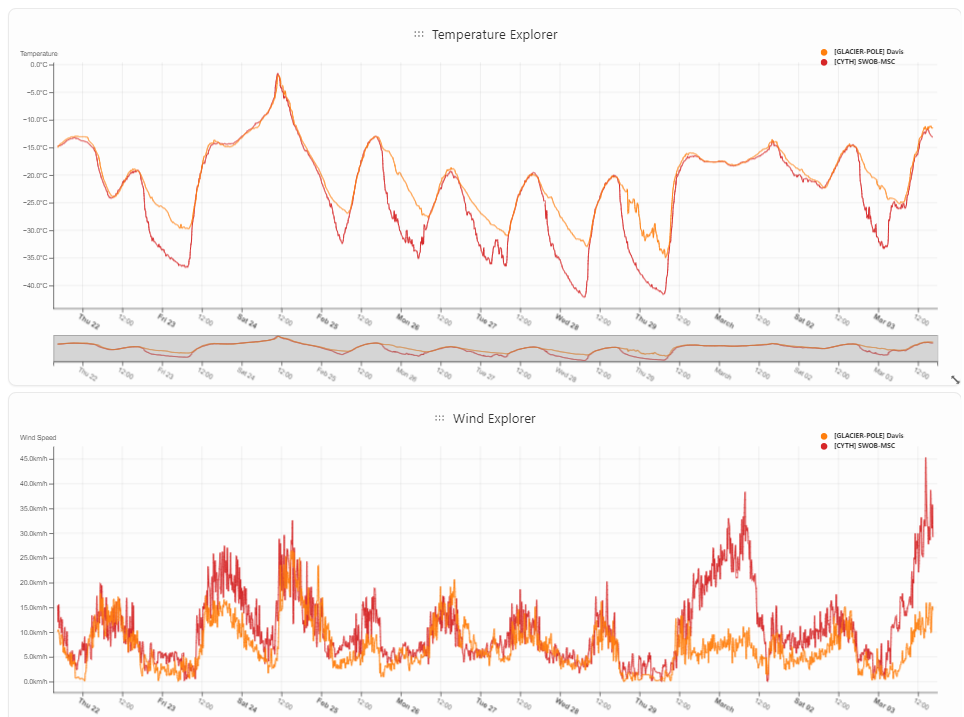
Figure 1: Example nocturnal temperature inversion Thompson airport vs Glacier test site.
User Guide
The following user guide explains many options to use the Wx Dashboard, and is organized into the following main sections:
- System configuration and data flows
- Dashboard – available data plots are described along with explanation of user input selections.
- Meteogram – description of data presented.
- Icing Matrix
- Data Explorer
- Data sources and nomenclature
System configuration and data Flows
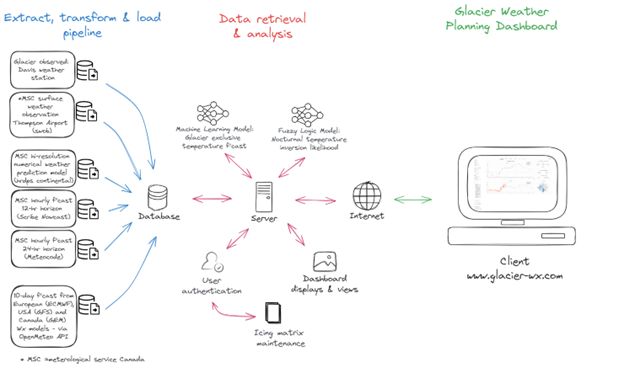
The schematic diagram of Figure 2 illustrates general arrangement of the Weather Dashboard. A cloud-based API server supports data collection, analysis, and display functions to deliver the Dashboard to users in the form of a web application. Some of the key tasks are described below:
- ETL - The data ingestion pipeline collects both real-time and forecast meteorological data from multiple sources. Operations to extract, transform and load (ETL) data from disparate sources and file formats, into a local database are continuously performed by Weather Dashboard jobs. More detail about data sources is provided at the end of this guide. Data update cadence depends upon respective providers and varies from 1-minute to 6-hour intervals. All data needed for Dashboard functions is stored locally and should be available for future reference.
- Analysis – The Dashboard runs Glacier-customized temperature forecasts with machine-learning learning models, as well as likelihood predictions for nocturnal temperature inversion. Forecast skill is assessed using historical error statistics.
- Icing matrix – The Dashboard provides an option to store icing test matrices and to plot target icing temperature occurrences superimposed onto temperature forecasts. This function is available only to authorized users.
- User interface - data displays and views are provided, along with user-selected options.
Dashboard
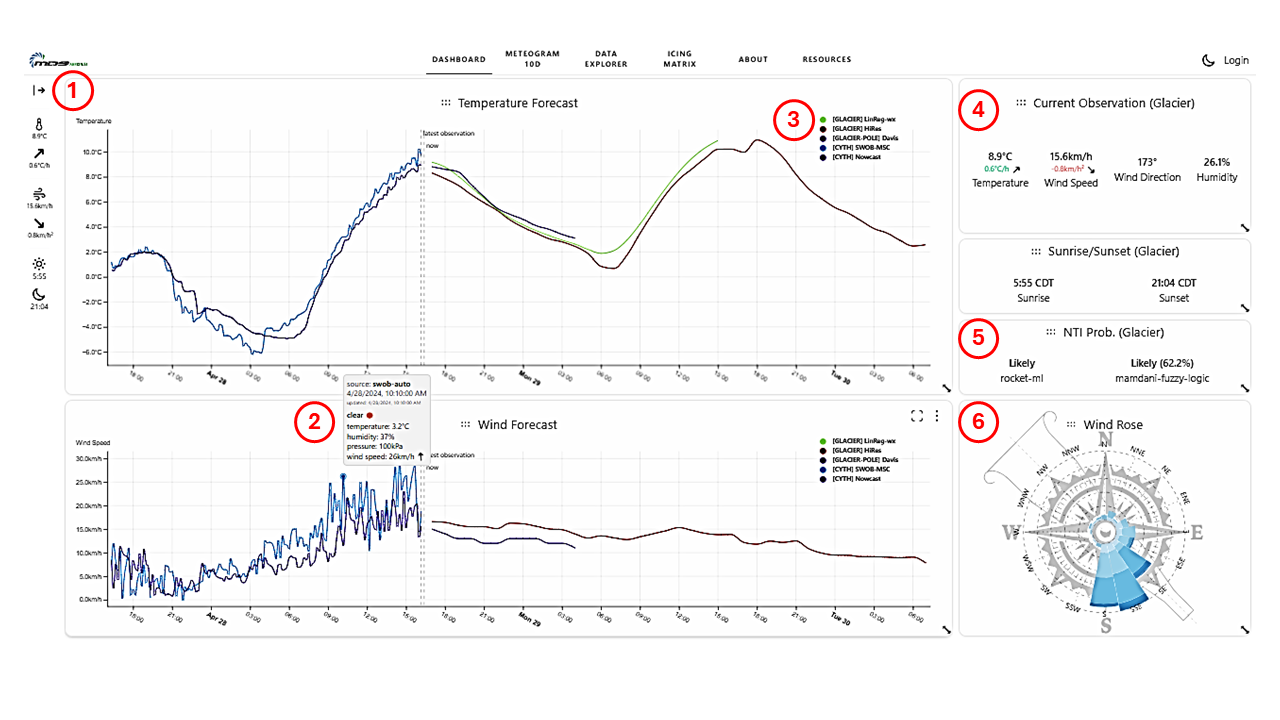
The Dashboard is considered a main landing page and the best location to find the current observed and most recent forecast conditions at Glacier. Figure 3 shows a sample Dashboard display.
Further information about Dashboard navigation and user selections follows below with reference to the numbered callouts shown in Figure 3.
User selectable option control panel - ①
The expanded control panel on the left-hand side of the Dashboard is shown in Figure 4, along with descriptive information about many of the user controls.

Datasets control: A side panel showing details of icing test occurrences expected within the forecast horizon can be opened or closed. |
Alternate Temperature units can be selected for Dashboard plots. |
The default time range for Dashboard plots is set to show trailing 24-hr observed and 48-hr forecast conditions, relative to the present time. By deselecting the Time Relative toggle, users could also choose a specific date/time range. |
Interval: Data binning is used to bring together multiple time series that are not synchronized: real-time observations may update minutely, whereas forecast epochs are often hourly. A 10-minute interval is recommended default, but users may select others. |
Trend Range: The Current Observation panel includes rate-of-change metrics for temperature and wind speed. The time base used for this derivation is user selectable. |
Sources: Default data sources are used for each data plot throughout the Weather Dashboard appropriate for intended purpose. These can be altered by users with the Sources control. Use the up/down spin control (▲/▼) on left hand side to open the drop-list. |
A choice of which temperature forecast used to calculate icing temperature occurrences is user selectable with the Icing Windows Sources control. |
The Observed Sources Filter can be used to remove forecast-type data sources from trailing observed temperature/wind plots to reduce clutter. |
When authorized users are signed in, the Display Icing Windows toggle would show/hide possible icing test windows based on the selected forecast. |
Chart Interactions: options with tooltips shown by mouse hovering over the 🛈 are self-explanatory. |
Note that color palettes used by the charts can also be changed with the discrete chart color picklists. |
Tool tip hover text - ②
Hover text boxes provide additional information such sky conditions and precipitation, where supported by the data provider.
Default sources and legend - ③
The default Dashboard charts are intended to display two observed data series, and three alternative forecasts. These are:
- Glacier Pole: observed conditions measured by a Davis™ weather station mounted near the icing tunnel intake at Glacier’s site B
- CYTH SWOB-MSC: Surface weather observations (swob) provided by the Meteorological Service of Canada (MSC) using an automated station at the Thompson, MB airport
- CYTH Nowcast – this forecast for Thompson provided by the MSC is updated hourly and gives a 12-hour forecast horizon. The Scribe Nowcast is intended to merge Numerical Weather Prediction output with current conditions and is updated interactively with a forecaster.
- Glacier Hi-Res: The MSC’s High Resolution Deterministic Prediction System (hrdps) gives numerical forecast on a 2.5k grid spacing. The hi-res models are updated on a 6-hour cycle and give a 48-hour forecast horizon. The forecast data presented by the Dashboard is geo-referenced to Glacier’s particular longitude and latitude.
- Glacier LinReg-wx: this forecast combines the Hi-Res (hrdps) model with customized modifiers which have been derived by machine learning algorithms together with training data collected across an entire calendar year.
Glacier current observation panel - ④
The current observation panel gives most recent data returned by the Davis™ weather station at Glacier site B. The data update interval is 10-minutes.
Rate of change derivations for temperature and wind speed also given in the panel may be useful to anticipate when icing condition targets become true.
Nocturnal inversion predictor - ⑤
The likelihood of nocturnal temperature inversion occurrence during the next 24-hours is predicted using both a fuzzy-logic algorithm and an alternative Rocket machine learning algorithm.
The purpose of this predictor is to highlight when NTI are expected to occur and inform test planners of potentially reduced temperature forecast confidence. NTI events are often characterized by distinctly warmer temperature at Glacier relative to public forecasts for the city of Thompson.
Wind rose and range slider - ⑥
The wind direction and speed shown by the wind rose also has the orientation of the icing tunnel superimposed onto the compass. This may be useful to test planners in case a particular test is sensitive to tail-wind or cross-wind conditions.
Further, range-sliders enabled on the time series charts allow users to explore how wind direction/speed are expected to change during the forecast period as shown in Figure 5.
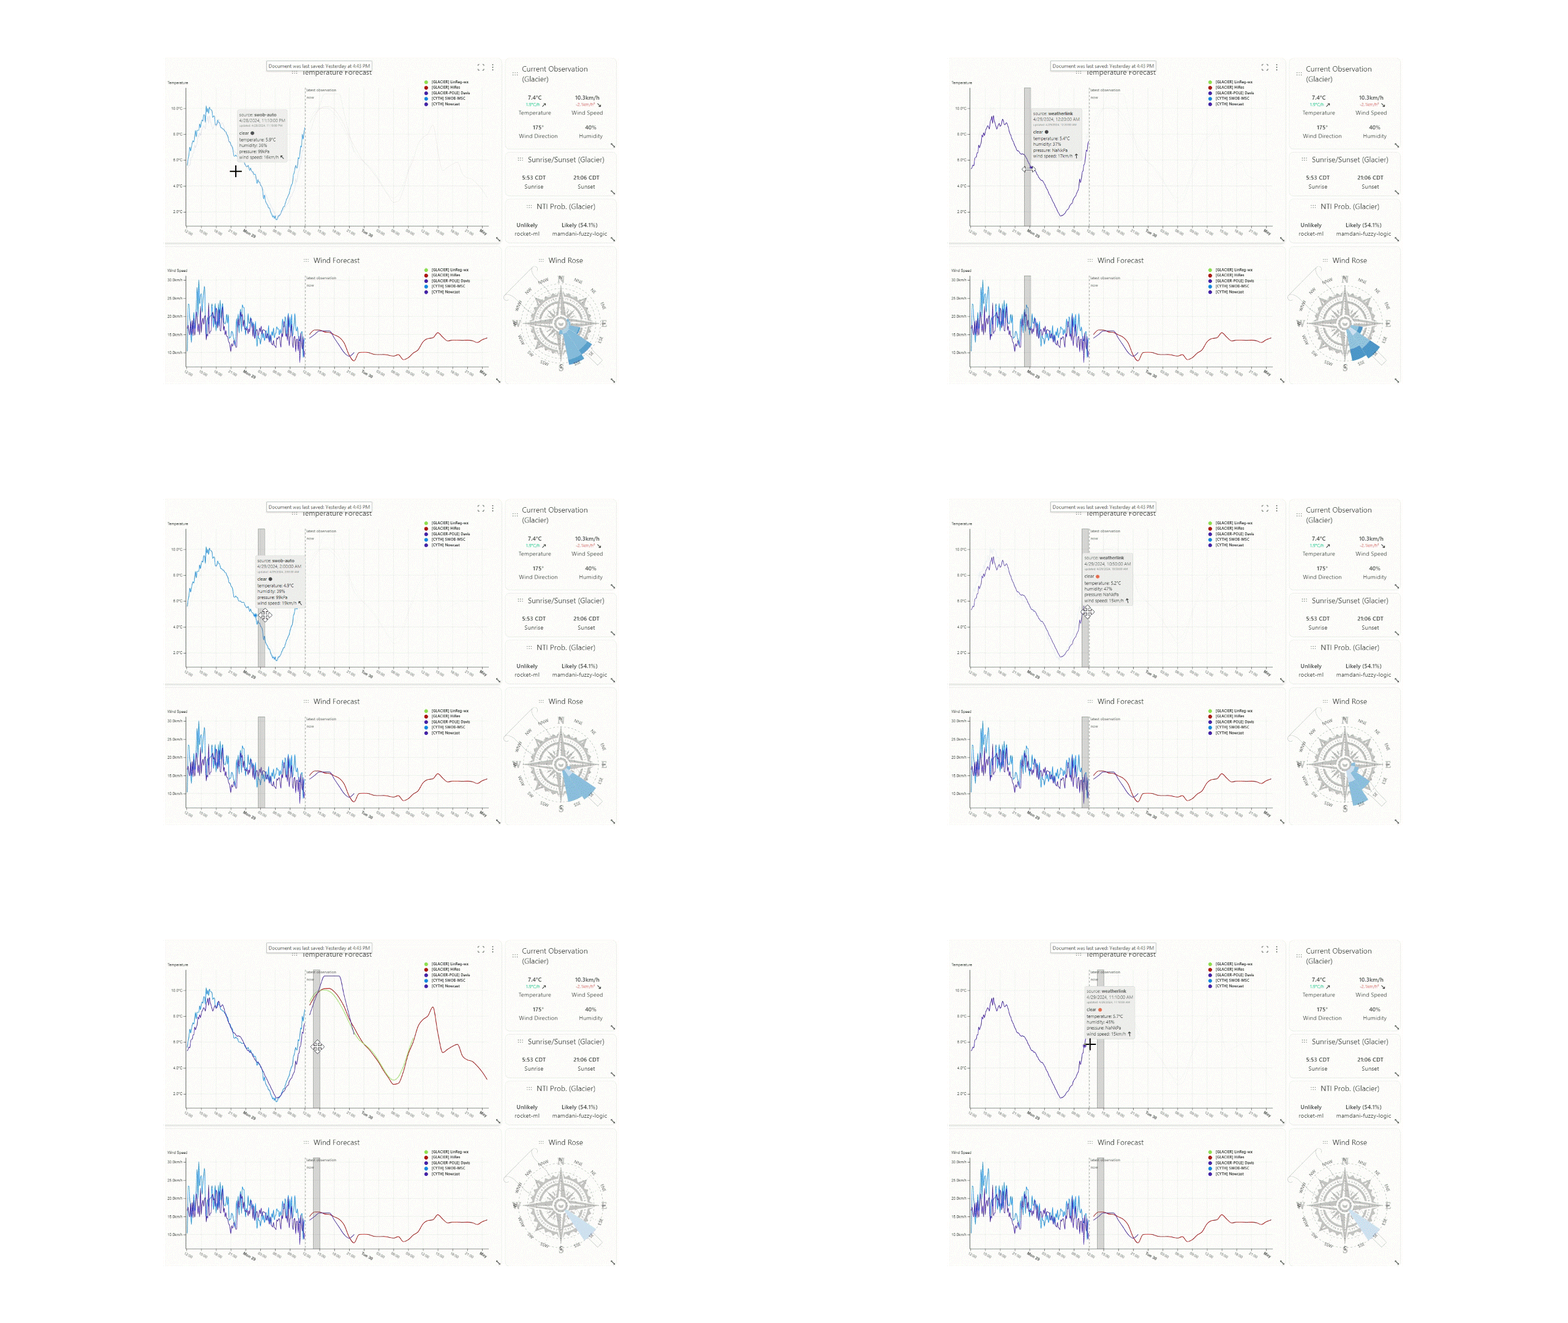
Figure 5: Range slider on time-series plots are linked to the wind rose.
Meteogram
The key information presented by the Meteogram is the forecast weather over the next 10-day horizon. An example of the Dashboard Meteogram is illustrated in Figure 6. The Meteogram gives test planners a general temperature trend outlook according to three different national forecasting agencies, namely:
- GFS: The Global Forecast System (GFS) is a numerical weather forecast provided by the US government agency National Centers for Environmental Prediction (NCEP).
- GEM: The Global Environmental Multiscale (GEM) model is a numerical weather prediction model developed by the Meteorological Research Division of Environment and Climate Change Canada.
- ECMWF-IFS: European Centre for Medium-Range Weather Forecasts (ECMWF) provides the Integrated Forecast System (IFS).
Plotting icing test windows onto the 10-day temperature forecast is also enabled on the Meteogram page. Use the left hand control panel following description of Figure 4.
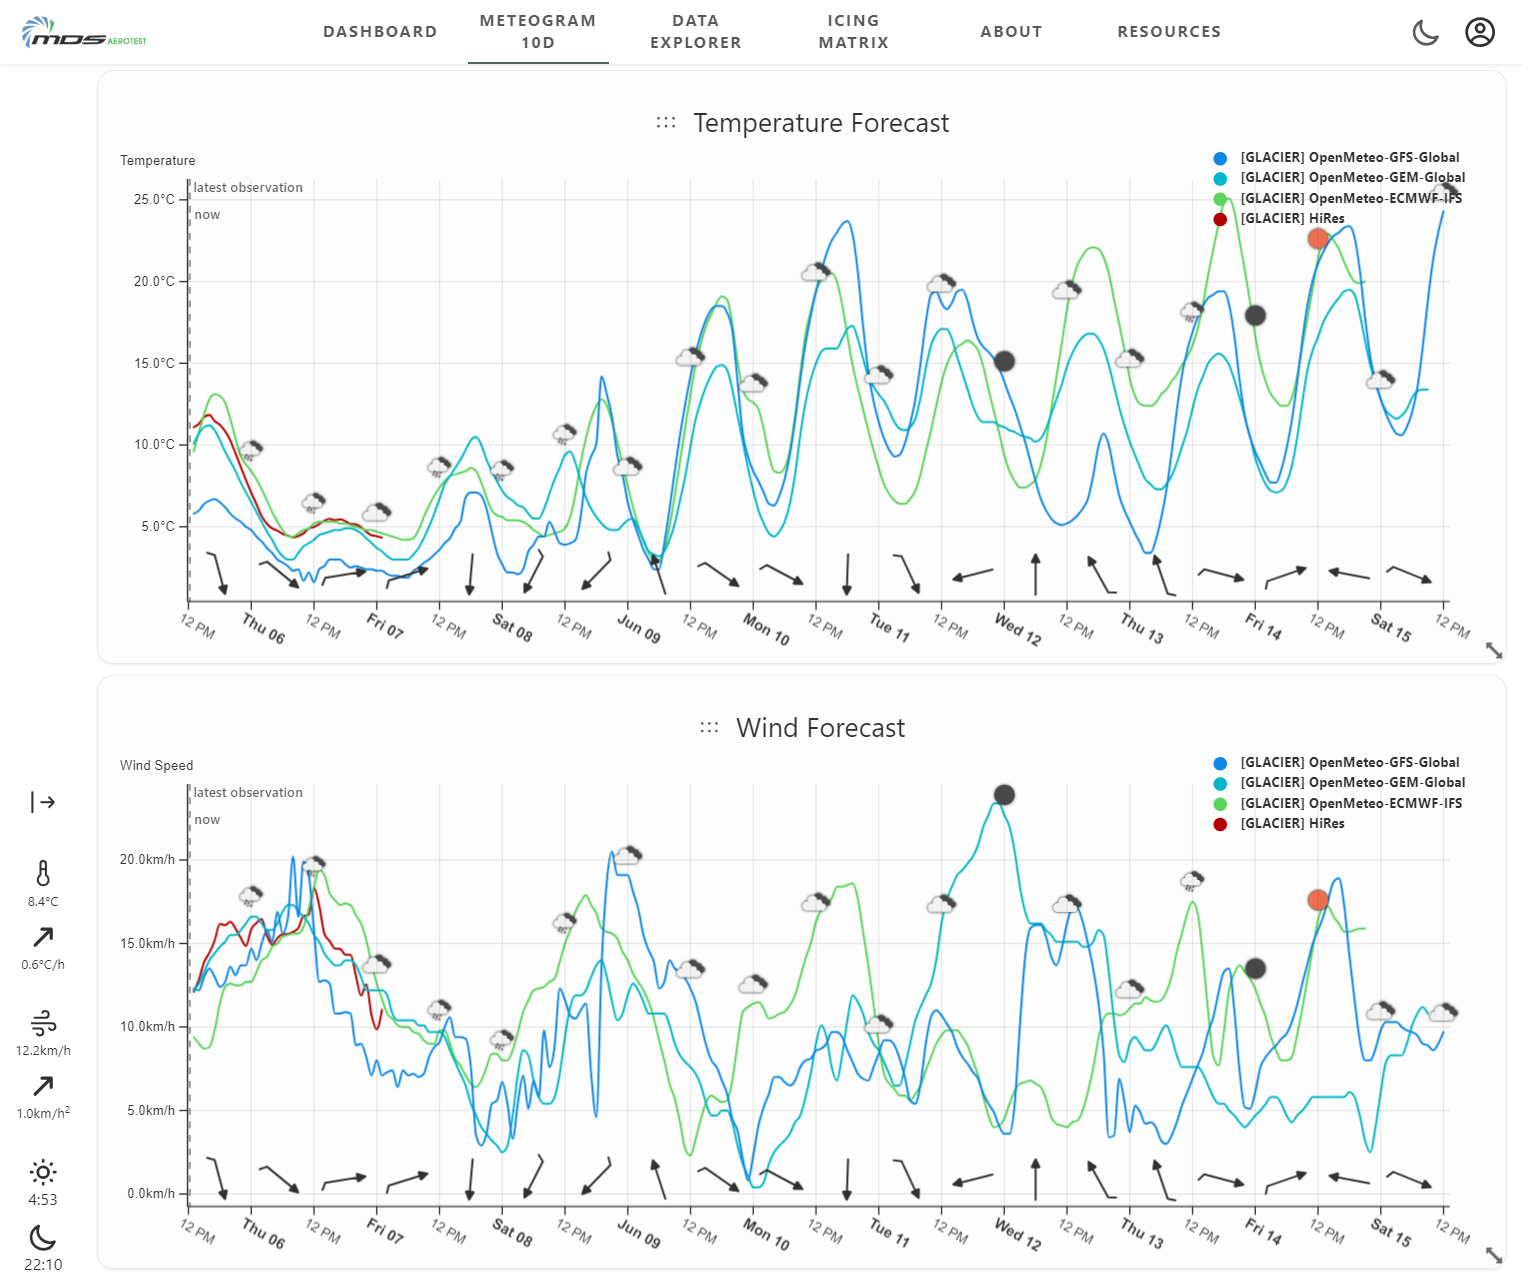
Figure 6: Sample Weather Dashboard meteogram showing 10-day forecast horizon.
Data Explorer
The Data Explorer page provides a tool for browsing and deep-dive inspection of the Weather Dashboard’s archived data.
The chart arrangement and user controls are similar to the Dashboard and Meteogram pages, but the present page also enable data viewing in tabular format and data export to selected file formats.
It is worth noting that the data explorer also provides a forecast skill score for temperature and wind speed predictions. This is presented as a plot of Mean Average Error (MAE) between forecast and true conditions against time horizon – an example is shown in Figure 7.
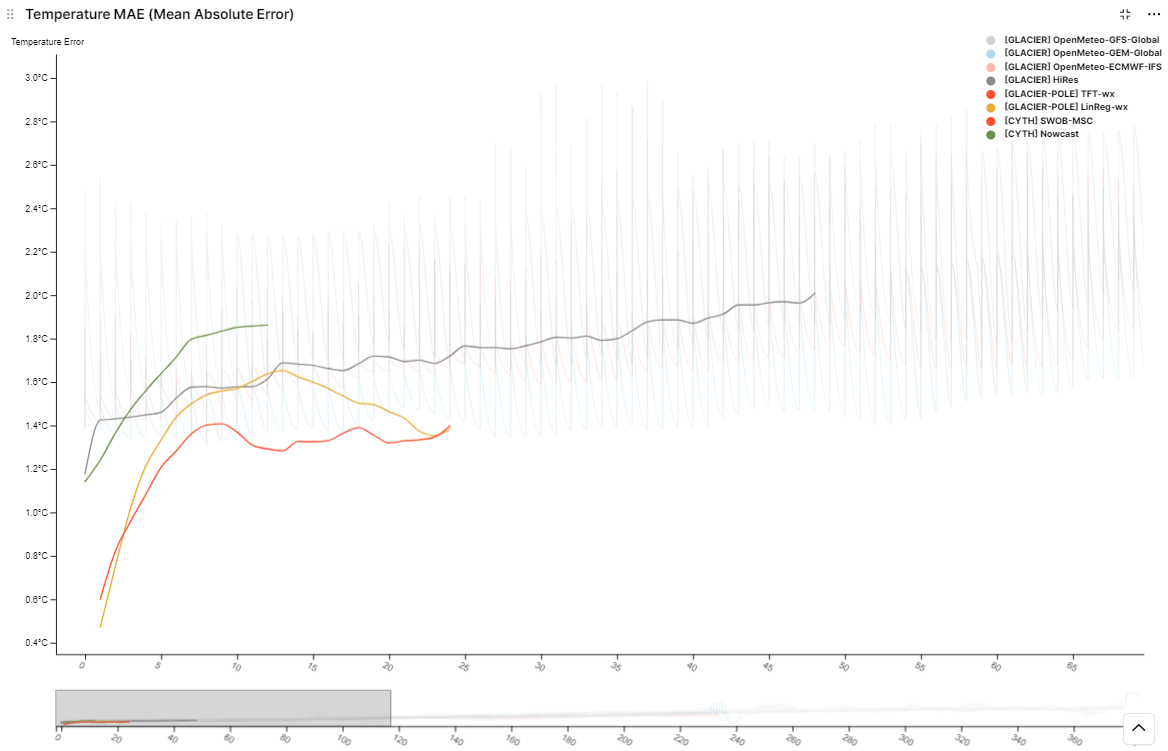
Figure 7: Sample temperautre forecast skill score. In this case data shows that the Machine Learning TFT algorithm has improved upon hte MSC's high resolution deterministic prediction for the nearest 24hr time-frame.
Icing Matrix
The Weather Dashboard provides an option to store icing test matrices and to further plot target icing temperature occurrences superimposed onto temperature forecasts. An example result is shown by Figure 8.
Users may load their own icing test matrix, and edit or add notes as desired. Users may also choose which forecast to use for plotting opportunity windows. When a test point is flagged as complete, it is no longer shown on Dashboard plots.
Access to the forecasting dashboard is public, however some information (e.g. icing matrices, profile options, etc.) is only available to authenticated users. Access is by invitation only, and managed by dashboard administrators. With login ID, data access and visibility between user agencies is not permitted.
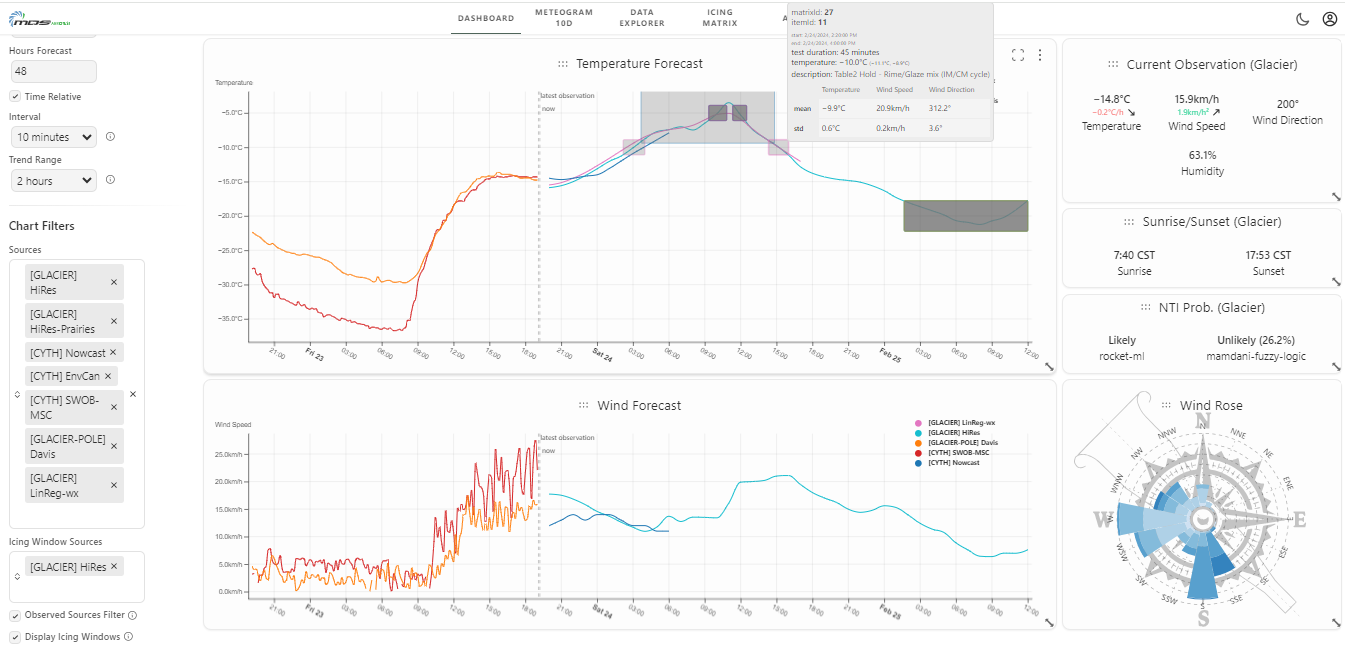
Figure 8: Sample Dashboard temperature forecast with icing window occurences superimposed.
Data source nomenclature
| Name | Description | |
| 1 | obs-CYTH-EnvCan | Surfaced weather observation at the Thompson, MB airport by MSC station id 5062921. Updates are available 1/hour at the Environment Canada citypage web site (https://weather.gc.ca/city/pages/mb-34_metric_e.html), but the dashboard updates 1/day. This is the same as observer station as item 3 below, but obtained by a different, legacy data path. Kept for historical continuity. |
| 2 | obs-CYTH-SWOB_MSC | Surface weather observations at the Thompson, MB airport by MSC station id 5062918. This is an automated station with updates are available 1/minute. |
| 3 | obs-CYTH-SWOB_NavCan | Surface weather observations at the Thompson, MB airport by MSC station id 5062921. Observations are manually recorded hourly by NavCanada. |
| 4 | obs-Glacier-Davis.Pole | Observation by a Davis™ VantagePro automated weather station installed at the Glacier test site on a pole near wind tunnel intake. 10-minute update frequency |
| 5 | obs-Glacier-Davis.TestStand | Observation by a Davis™ VantagePro automated weather station installed near the top of the Glacier test stand. 10-minute update frequency. |
| 6 | f'cst-CYTH-ECMWF | A numerical weather prediction georeferenced to the Thompson, MB airport. This forecast is derived from the European Centre for MediumRange Weather Forecasts (ECMWF) Integrated Forecasting System (IFS). The ECMWF-IFS provides a 10-day forecast horizon with 25km resolution, every 6 hours. Further info: https://www.ecmwf.int/en/forecasts/datasets/open-data |
| 7 | f'cst-CYTH-GEM | A numerical weather prediction georeferenced to the Thompson, MB airport. This forecast is derived from Meterological Service Canada’s Global Environmental Multiscale (GEM). The operational model called Global Deterministic Prediction System (GDPS) provides a 10day forecast horizon at 15km resolution, updated every 12 hours. |
| 8 | f'cst-CYTH-GFS | A numerical weather prediction georeferenced to the Thompson, MB airport. This forecast is derived from the United States National Oceanic and Atmospheric Administration’s (NOAA) Global Forecast System (GFS). The GFS provides a 16-day forecast horizon at 13km resolution, updated every 6 hours. |
| 9 | f'cst-CYTH-hrdps | A numerical weather prediction georeferenced to the Thompson, MB airport. This MSC’s high resolution deterministic prediction system (HRDPS) is a limited area forecast using a grid subsetted from the GEM model. The Continental HRDPS provides as 48-hour forecast horizon with 2.5km resolution, updated every 6 hours. |
| 10 | f'cst-CYTH-ICON | A numerical weather prediction georeferenced to the Thompson, MB airport. This forecast is derived from Germany’s Duetscher Wetterdienst (DWD) ICON global model. The ICON model provides a 180-hour forecast horizon at 13km resolution, updated every 6 hours. |
| 11 | f'cst-CYTH-JMA | A numerical weather prediction georeferenced to the Thompson, MB airport. This forecast is derived from the Japan Meteorological Agency (JMA) Global Spectral Model. The JMA model provides a 11- day forecast horizon at 55km resolution, updated every 6 hours. Further info: https://www.jma.go.jp/jma/en/Activities/nwp.html |
| 12 | f'cst-CYTH-MeteoCode | Meteocode is the detailed hour-by-hour numeric version of Environment Canada's public text forecast. It's also known by some as the corrected or adjusted SCRIBE. Data extracted from the numerical weather models for specific locations across Canada, known as SCRIBE points, are then automatically adjusted for known biases and local weather effects. Each public forecast zone has at least 1 SCRIBE point, and the forecasters use this data when creating the public forecast. Environment Canada derives the short term Meteocode for each region by taking the forecast data from one or more representative SCRIBE points with the region, and adjusting it based on expert opinion. SCRIBE Matrices are unique to Environment Canada, used to produce the public forecast. The SCRIBE Matrices are also known as 'uncorrected SCRIBE', as they have not yet been modified by a human forecaster. The Meteocode forecast has a 24-hour horizon, and is updated 3 times each day at 5:00AM, 11:00AM and 4:00PM local time. |
| 13 | f'cst-CYTH-MétéoFrance | A numerical weather prediction georeferenced to the Thompson, MB airport. This forecast is derived from the ARPEGE model of France. The ARPEGE model provides a 4-day forecast horizon at 25km resolution, updated every 6 hours. Further info: https://www.umr-cnrm.fr/spip.php?article121&lang=en |
| 14 | f'cst-CYTH-NowcastScribe | The Nowcast is a forecast product unique to Environment Canada. It was developed to assist forecasters when producing the public forecast. The Nowcast relies on recent observed weather, as well as Numerical Weather Prediction models, Statistical models and Nowcasting systems together with forecaster input to produce a very short term (12 hour) forecast. The Scribe Nowcast gives a 12-hour forecast horizon for selected public locations, and is updated hourly. |
| 15 | f'cst-Glacier-ECMWF | A numerical weather prediction georeferenced to the Glacier test site. See above for model particulars. |
| 16 | f'cst-Glacier-GEM | A numerical weather prediction georeferenced to the Glacier test site. See above for model particulars. |
| 17 | f'cst-Glacier-GFS | A numerical weather prediction georeferenced to the Glacier test site. See above for model particulars. |
| 18 | f'cst-Glacier-hrdps | A numerical weather prediction georeferenced to the Glacier test site. See above for model particulars. |
| 19 | f'cst-Glacier-ICON | A numerical weather prediction georeferenced to the Glacier test site. See above for model particulars. |
| 20 | f'cst-Glacier-JMA | A numerical weather prediction georeferenced to the Glacier test site. See above for model particulars. |
| 21 | f'cst-Glacier-MétéoFrance | A numerical weather prediction georeferenced to the Glacier test site. See above for model particulars. |
| 22 | f'cst-Glacier-LGBM.Pole | This experimental forecast takes the Glacier HRDPS as a basis with a machine learning modifier from the LightGBM algorithm Light gradient-boosting machine is a gradient boosting model using uses decision trees to make predictions. |
| 23 | f'cst-Glacier-LinReg.Pole | This experimental forecast takes the Glacier HRDPS as a basis with a machine learning modifier from a simple linear regression model. |
| 24 | f'cst-Glacier-TFT.Pole | This experimental forecast takes the Glacier HRDPS as a basis with a machine learning modifier from the TFT algorithm. Temporal Fusion Transformer (TFT) is a deep learning model that combines long short-term memory blocks (LSTM) for time-dependent processing and processing information across time steps. |